County characteristics and US home values
Question and headline finding
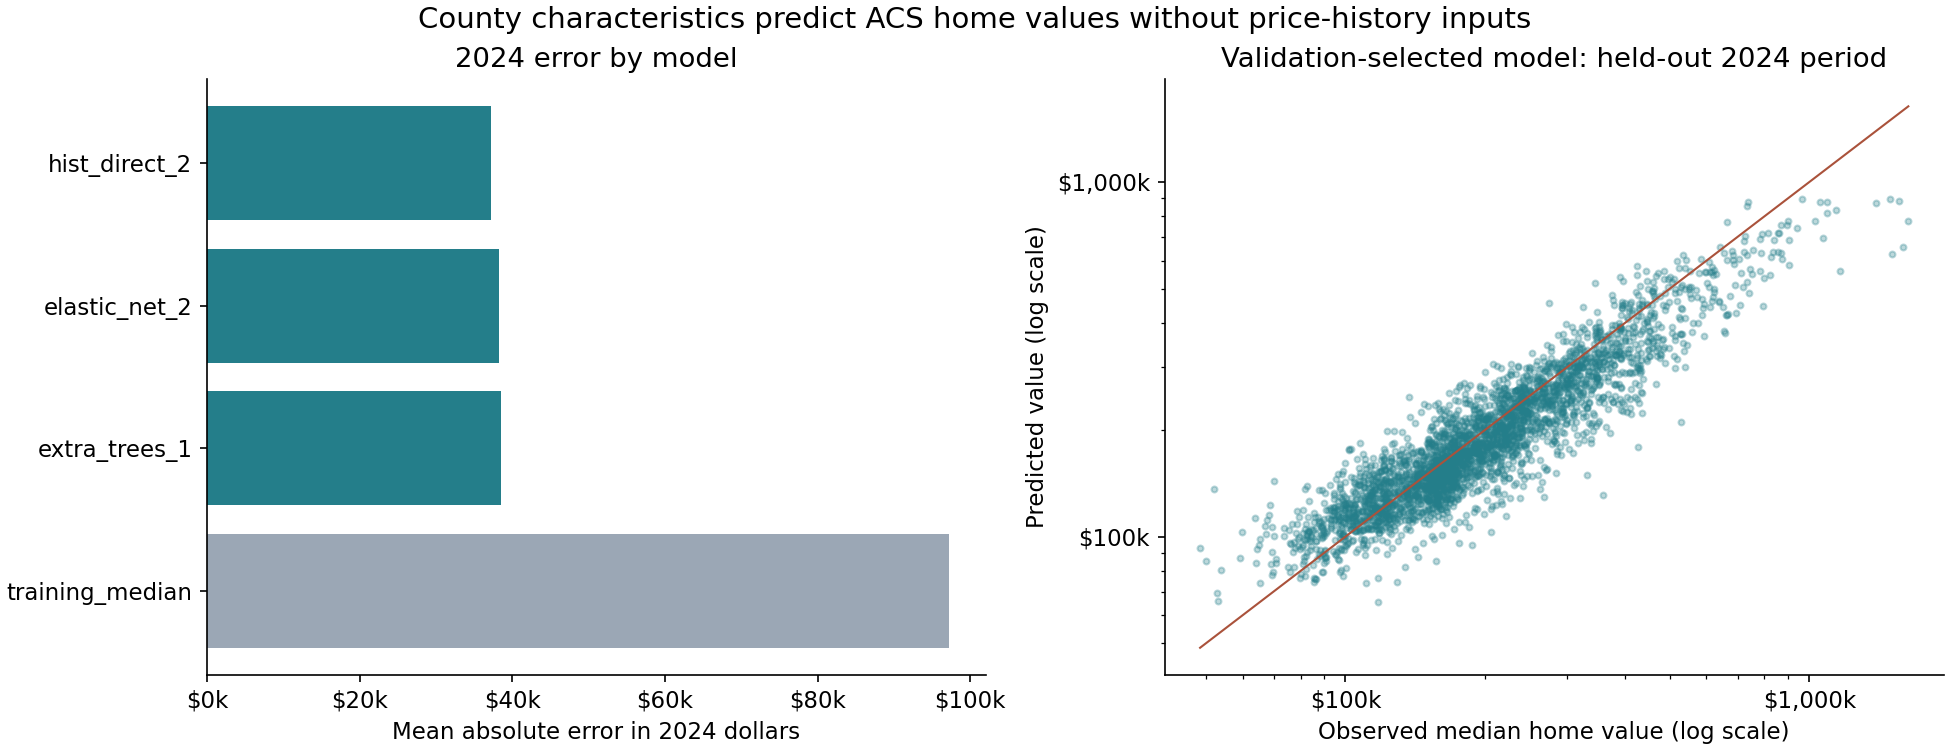
The validation-selected model (hist_direct_2) explains 80.1% of the held-out 2024 cross-county variance (R²), with a $37,198 mean absolute error. Its RMSLE is 63.5% lower than the training-median baseline.
These are out-of-period predictions using characteristics measured in the same ACS window as the outcome. They establish predictive association, not causation or advance forecasting.
Data journey
Existing Census, FEMA, NOAA and climate inputs feed DuckDB marts, then an audited panel of 9,420 county-period observations and 57 primary predictors. The periods are 2010–2014, 2015–2019 and 2020–2024; values are in 2024 dollars. The target is median owner-occupied home value, not transaction price.
See coverage.csv, exclusions.csv, geography_audit.csv, missingness.csv and feature_manifest.csv for the exact sample.
Model evidence
| Model | 2024 MAE | RMSLE | R² |
|---|---|---|---|
| training_median | $97,194 | 0.573 | -0.280 |
| hist_direct_2 | $37,198 | 0.209 | 0.801 |
| extra_trees_1 | $38,471 | 0.216 | 0.794 |
| elastic_net_2 | $38,250 | 0.218 | 0.809 |
Removing the economic feature group increases 2024 RMSLE the most (24.6%). Group removal uses the fixed selected specification, so it measures reliance by this model rather than a causal contribution.
The separate geographic evaluation gives these unweighted means across five county-disjoint folds:
| Family | Geographic MAE | RMSLE | R² |
|---|---|---|---|
| elastic_net | $27,088 | 0.190 | 0.829 |
| extra_trees | $25,420 | 0.181 | 0.836 |
| hist_gradient_boosting | $24,607 | 0.176 | 0.841 |
| training_median | $66,847 | 0.466 | -0.078 |
Parameters and model family were selected on 2014 → 2019 validation before evaluating 2024. The final evaluation fit uses 2014 and 2019. Geographic evaluation uses five county-disjoint folds with tuning repeated inside each fold on pre-2024 data.
Within-county associations
The fixed-effects regression uses 3,121 balanced, complete counties. It controls for county and period effects. Intervals use county-clustered standard errors. Its within R² is 0.132, so these six predictors account for a substantially smaller share of variation after removing persistent county differences and common period effects. This R² has a different denominator from the prediction benchmark above.
| Predictor | Log-value coefficient | 95% interval |
|---|---|---|
| log1p__median_household_income_2024_usd | 0.3923 | [0.3244, 0.4602] |
| bachelors_degree_or_higher_pct | 0.0062 | [0.0041, 0.0082] |
| vacant_housing_units_pct | -0.0048 | [-0.0069, -0.0028] |
| detached_single_unit_pct | 0.0016 | [-0.0002, 0.0034] |
| mean_commute_time_minutes | 0.0016 | [-0.0007, 0.0039] |
| average_household_size | 0.1021 | [0.0459, 0.1583] |
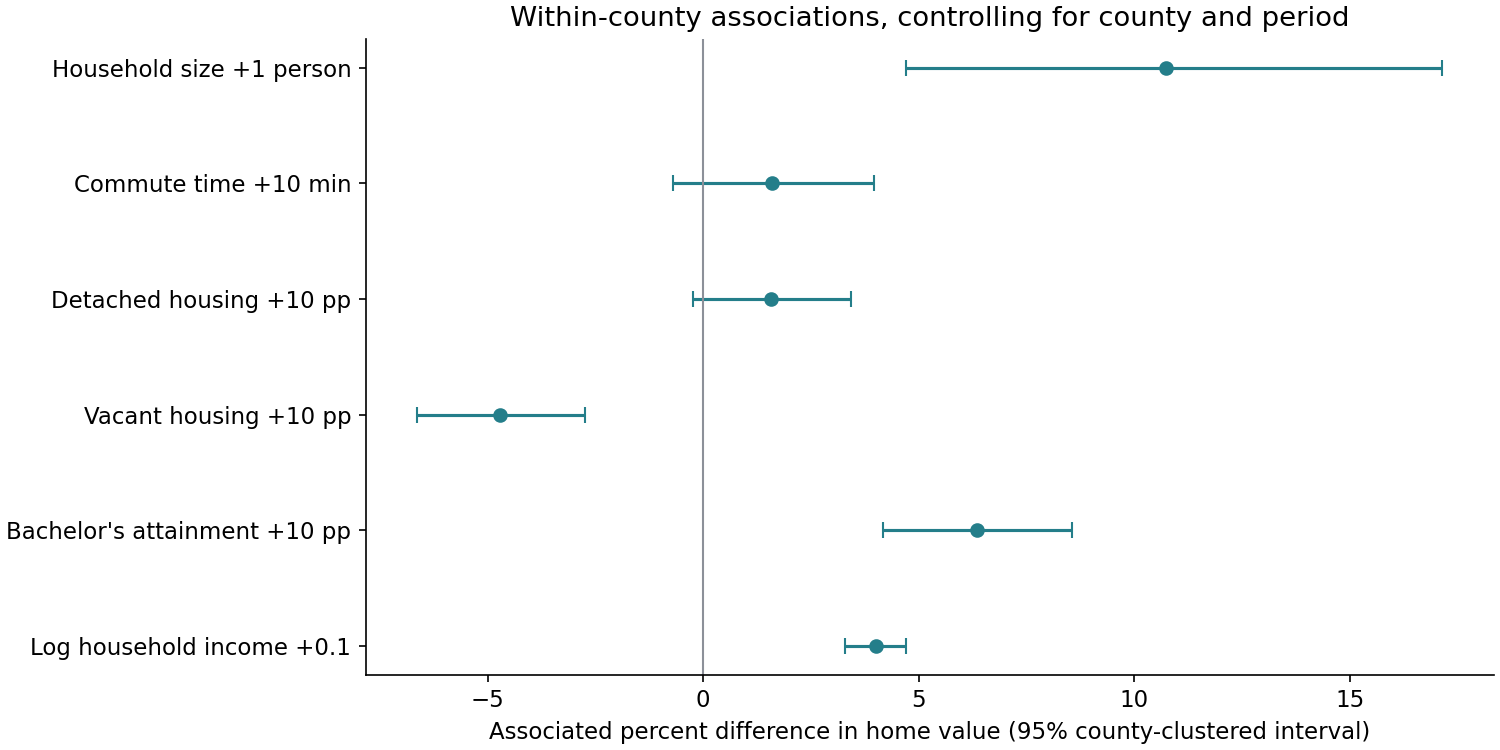
A percentage predictor is measured in percentage points; log income is in log1p dollars. Cross-county relationships need not have the same sign as within-county changes. See associations_by_period.csv, coefficient_stability.csv and group_permutation.csv for stability diagnostics.
What characteristics add to forecasting
Adding characteristics changes held-out RMSLE by 2.8% relative to the history-only model (positive means improvement). This separate experiment predicts the next overlapping ACS estimate.
| Design | 2023–2024 MAE | RMSLE |
|---|---|---|
| previous_value | $10,955 | 0.067 |
| history_only | $7,719 | 0.056 |
| history_plus_characteristics | $7,538 | 0.055 |
Website handoff
website_data/counties.json contains FIPS, observed period values, selected characteristics, predictions and residuals. Join it to matching-vintage county boundaries when implementing the county map; geometry is not bundled. The other JSON files support model comparisons, error charts, association plots and response curves. Host these static results; do not train in the browser.
Limitations
- Observational associations, not causal effects or individual-house appraisals.
- Same-period ACS characteristics estimate home values; this is not advance forecasting.
- Geographic folds are county-disjoint but neighboring counties can remain correlated.
- Fixed-effects sample excludes known changes and incomplete histories; no areal crosswalk.
- Minor boundary changes and ACS margins of error are not modeled.
- Annual forecast labels overlap four ACS survey years; release vintages are not reconstructed.
- 2024 ACS five-year estimates were released January 29, 2026; no operational end-2024 forecast claim.
- Hazard absence is assumed zero in event marts; reporting and mapping gaps may remain.
- Metro labels come from a static reference and are used only for error breakdowns.
- Ablations and explanations are prespecified held-out diagnostics, not model-selection evidence.
Reproduce
python -m src.cli.run_county_characteristics
python -m unittest discover -s tests -v